
Data Profiling Tools: Understanding Your Data Before You Clean It
Data profiling tools are software platforms that analyze the structure, content, completeness, and quality of datasets before any cleaning, transformation, or integration work begins. These tools scan records at the field level to surface statistics including null rates, format distributions, uniqueness percentages, value ranges, and pattern frequencies, giving data teams a quantified picture of what their data actually looks like versus what they assume it looks like.
Once profiling surfaces the quality issues, the cleansing step is typically handled by data scrubbing software that automates format and value corrections at scale.
Profiling is the diagnostic step that prevents the most expensive mistake in enterprise data quality: writing cleaning rules to fix assumed problems rather than measured ones. According to Gartner, 59% of organizations do not measure data quality at all, which means the majority of cleaning efforts operate without a factual baseline. This guide covers what data profiling tools do, how to evaluate them for enterprise use, and how profiling fits into a broader data cleansing guide.
Key Takeaways
- ✓Data profiling tools provide the quantified baseline that all cleaning, matching, and deduplication efforts should build on. Without profiling, data teams fix assumed problems.
- ✓The three core profiling techniques are column profiling (field-level analysis), cross-column profiling (relationship analysis), and cross-table profiling (referential integrity checks).
- ✓Enterprise profiling tools must integrate with data pipelines for continuous monitoring, not just pre-project analysis. Quality degrades at approximately 2% per month.
- ✓Profiling before migration prevents the most common enterprise data project failure: discovering quality problems after data has already been loaded into the target system.
- ✓Look for profiling tools that feed results directly into cleaning and matching rule configuration, eliminating the manual translation step between diagnosis and treatment.
What Is Data Profiling?
Data profiling is the process of systematically examining a dataset to produce summary statistics and quality assessments for every field and relationship within it. Unlike data cleaning (which fixes problems) or data governance (which defines policies), profiling is purely diagnostic: it tells you what your data looks like right now, without changing anything.
A profiling analysis on a 3-million-record customer database might reveal that the "email" field is 94% complete but only 71% valid (meaning 29% of populated email addresses fail structural validation). The "state" field might contain 47 distinct values when only 50 US states plus territories are expected, indicating possible misspellings or non-standard entries. The "phone" field might show 11 different format patterns across the dataset.
These findings become the specification for cleaning rules. Without profiling, a data steward guesses at which fields need attention and writes rules based on experience rather than evidence. With profiling, every rule addresses a measured problem, and the impact of each rule is quantifiable against the baseline.
What Are the Three Core Data Profiling Techniques?
Enterprise profiling tools use three complementary techniques that together provide a complete picture of dataset quality.
Column Profiling (Field-Level Analysis)
Column profiling examines each field independently to produce statistics including data type distribution, null/empty rate, distinct value count, minimum/maximum values, mean and standard deviation for numeric fields, pattern and format frequency, and value distribution histograms. This is the most common profiling technique and the starting point for every profiling project.
Cross-Column Profiling (Relationship Analysis)
Cross-column profiling examines dependencies and correlations between fields within the same table. Does the ZIP code match the state? Does the country code align with the phone number format? Are there functional dependencies (if field A has a specific value, field B should always have a corresponding value)? This technique catches errors that column profiling misses because each field might be individually valid but contradictory in combination.
Cross-Table Profiling (Referential Integrity)
Cross-table profiling checks relationships across tables and systems. Do all customer IDs in the orders table exist in the customer master? Do all product codes in the invoice table match entries in the product catalog? Orphaned references, the most common cross-table quality problem, cause silent downstream failures in reporting and analytics because joins return fewer rows than expected without generating errors.
Data Profiling Techniques Comparison
| Technique | What It Analyzes | Example Findings | Downstream Action |
|---|---|---|---|
| Column Profiling | Individual field statistics: completeness, uniqueness, patterns, value distributions. | "State" field has 47 distinct values; "Phone" has 11 format patterns; "Email" is 71% valid. | Standardization rules for format consistency; validation rules for structural correctness. |
| Cross-Column Profiling | Relationships between fields: dependencies, correlations, contradictions. | 12,400 records where ZIP code does not match state; 8% of records where country code conflicts with phone format. | Cross-field validation rules; enrichment from reference data to resolve conflicts. |
| Cross-Table Profiling | Referential integrity: orphaned records, broken foreign keys, missing master records. | 3,200 order records reference customer IDs not found in customer master; 890 invoice line items have invalid product codes. | Referential integrity repair; source system investigation for root cause. |
When Should You Run Data Profiling?
Profiling is most commonly triggered by four enterprise scenarios, each with different scope and urgency requirements.
Before data migration: Profiling the source system reveals quality problems that will compound in the target system if left uncorrected. A 200-location retail chain profiling 4.2 million customer records before a CRM migration discovered that 21% of state fields used non-standard formats, a problem invisible without profiling that would have created matching failures in the new system.
Before data integration: When merging data from acquisitions or consolidating siloed systems, profiling both sources reveals schema conflicts, format differences, and overlap rates that determine the integration approach. data cleaning for enterprise depend on profiling baselines to measure improvement.
Before AI/ML model training: Models trained on dirty data produce confidently wrong predictions. Profiling training data for completeness, consistency, and bias before model development prevents the most expensive form of data quality failure: deploying a production model that makes decisions based on flawed input.
As continuous pipeline monitoring: Embedding profiling into data pipelines catches quality degradation as it occurs, rather than during quarterly reviews. This continuous approach aligns with the DAMA-DMBOK framework's quality improvement lifecycle: define, measure, analyze, improve, and control.
What Should You Look for in Enterprise Data Profiling Tools?
The profiling tool market ranges from lightweight open-source options (OpenRefine, Apache Griffin) to full enterprise platforms (Informatica, IBM InfoSphere, Ataccama). For enterprise buyers, six capabilities separate tools that provide one-time snapshots from platforms that drive ongoing quality programs.
Enterprise Evaluation Criteria for Data Profiling Tools
| Capability | What to Evaluate | Enterprise Impact |
|---|---|---|
| Automated Discovery | Automatically detects data types, patterns, and statistical outliers without manual configuration for each field. | Reduces profiling setup from days to minutes. Critical for datasets with hundreds of fields across multiple systems. |
| Multi-Source Connectivity | Native connectors to databases (SQL Server, Oracle, PostgreSQL), CRMs (Salesforce, Dynamics 365), ERPs, flat files, and cloud platforms. | Enterprise data lives in 5 to 15 systems. Tools limited to CSV imports miss cross-system profiling entirely. |
| Pipeline Integration | API-based embedding into ETL/ELT pipelines with scheduled and event-triggered profiling runs. | Converts profiling from a project-based activity to continuous monitoring. Catches quality drift between review cycles. |
| Profile-to-Rule Workflow | Profiling findings can be directly converted into cleaning, validation, or standardization rules without manual re-entry. | Eliminates the gap between diagnosis and treatment. MatchLogic's profiling engine feeds directly into its rule-based cleaning and matching pipeline. |
| Scale Performance | Profiles millions of records in minutes without memory overflow or accuracy degradation. | Proof-of-concept profiling on 50,000 records means nothing if the tool cannot handle 50 million in production. |
| On-Premise Deployment | All data processing happens within the organization's infrastructure. No records sent to external endpoints. | Non-negotiable for organizations processing PHI, PII, or data subject to HIPAA, SOX, GDPR, or data sovereignty regulations. |
How Does Data Profiling Drive Better Outcomes? A Real-World Example
A 500-bed hospital system preparing for an EHR migration from a legacy system to Epic needed to consolidate patient records from three facilities. The data team assumed the primary quality issue was duplicate patient records across locations. Before writing any deduplication rules, they ran a full profiling analysis across 2.1 million patient records.
Profiling revealed that duplicates were only the fourth most impactful problem. The top three were: 34% of "date of birth" fields contained dates in formats the target system could not parse (MM-DD-YYYY versus the required YYYY-MM-DD); 22% of medication records referenced drug codes from a formulary version that had been retired two years earlier; and 18% of insurance ID fields contained alphanumeric characters in positions that the target system's validation engine would reject as invalid.
Without profiling, the team would have focused exclusively on deduplication, loaded records with unparse able dates and invalid insurance IDs into Epic, and spent months after go-live fixing data that should have been cleaned during migration. The profiling analysis shifted 60% of the pre-migration cleaning effort to problems the team did not know existed, saving an estimated 2,200 hours of post-migration rework. For data standardization approaches, see our data standardization guide.
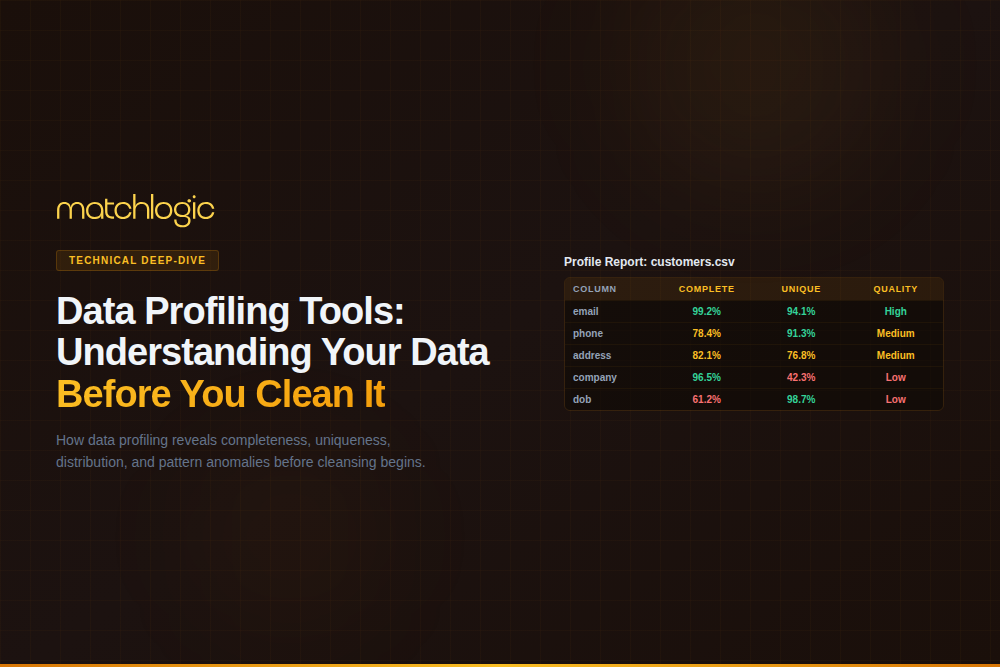
Visual Reference: MatchLogic Data Profiling Interface

Frequently Asked Questions
What are data profiling tools?
Data profiling tools are software platforms that analyze the structure, content, and quality of datasets by scanning records at the field level. They produce statistics including null rates, format distributions, uniqueness percentages, value ranges, and pattern frequencies. According to Gartner, 59% of organizations do not measure data quality, meaning most cleaning efforts operate without the factual baseline that profiling provides.
What is the difference between data profiling and data cleansing?
Data profiling is diagnostic: it examines data and reports what it finds without changing anything. Data cleansing is corrective: it applies rules and transformations to fix the problems that profiling identified. Profiling always comes first. Cleansing without profiling is the equivalent of prescribing medication without running diagnostic tests.
How long does data profiling take?
Enterprise profiling tools process 10 million records in under 10 minutes for column-level analysis. Cross-column and cross-table profiling adds time proportional to the number of relationships being checked. MatchLogic profiles millions of records in minutes, generating visual quality reports that data stewards can act on immediately.
Can data profiling tools detect duplicate records?
Profiling tools identify potential duplicate rates through uniqueness analysis and pattern matching, but they do not perform full deduplication. Profiling tells you that your dataset likely contains 25% duplicate records based on field-level uniqueness scores. Deduplication tools then use matching algorithms to identify and resolve the specific duplicate pairs. Profiling is the diagnosis; deduplication is the treatment.
What is column profiling?
Column profiling (also called field-level analysis) examines each column in a dataset independently to produce statistics including data type distribution, null/empty rates, distinct value counts, minimum and maximum values, format pattern frequency, and value distribution histograms. It is the most common profiling technique and the foundation for all subsequent data quality analysis.
Do I need data profiling for a data migration?
Profiling before migration is the single highest-ROI data quality activity. Migration projects that skip profiling discover quality problems after data has been loaded into the target system, when fixing errors costs 10 to 100 times more than catching them at the source (the 1-10-100 rule cited in data quality literature). A 500-bed hospital system saved an estimated 2,200 hours of post-migration rework by profiling before their EHR migration.


.svg)